ai Swing™ User Guide
ai Swing™ was developed as an **educational platform** for aspiring stock investors who want to improve their decision-making skills. While our system provides **data-driven insights**, investment choices are solely up to **the user**. We do **not recommend specific stocks**, nor are we responsible for any financial losses. Users must conduct their own research and make informed decisions.
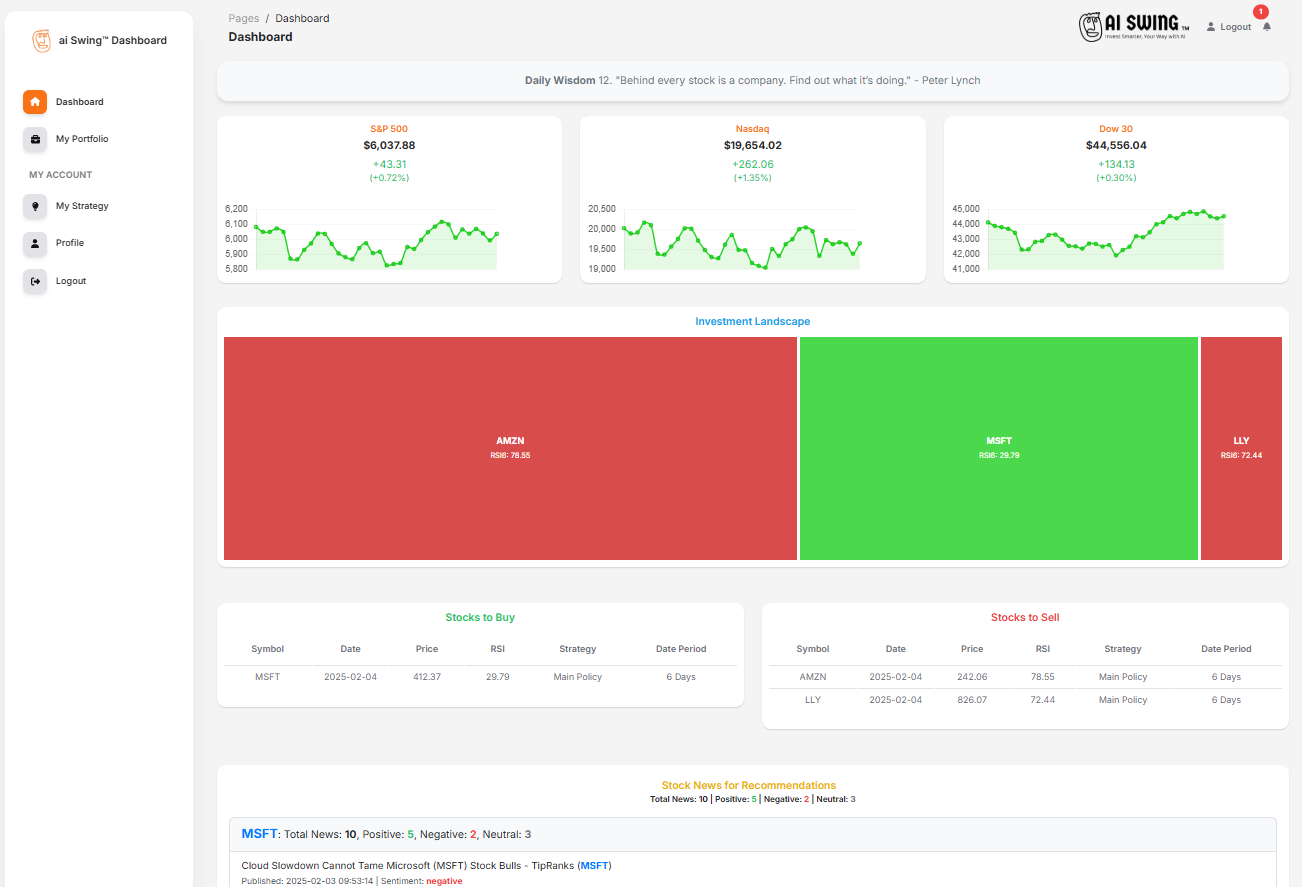
1. Dashboard Overview
The dashboard is your starting point, where you can view major stock indexes, monitor RSI-based investment signals, and receive buy/sell recommendations.
We prioritize **buying opportunities** based on RSI values, allowing users to develop strategies that align with their portfolio goals.
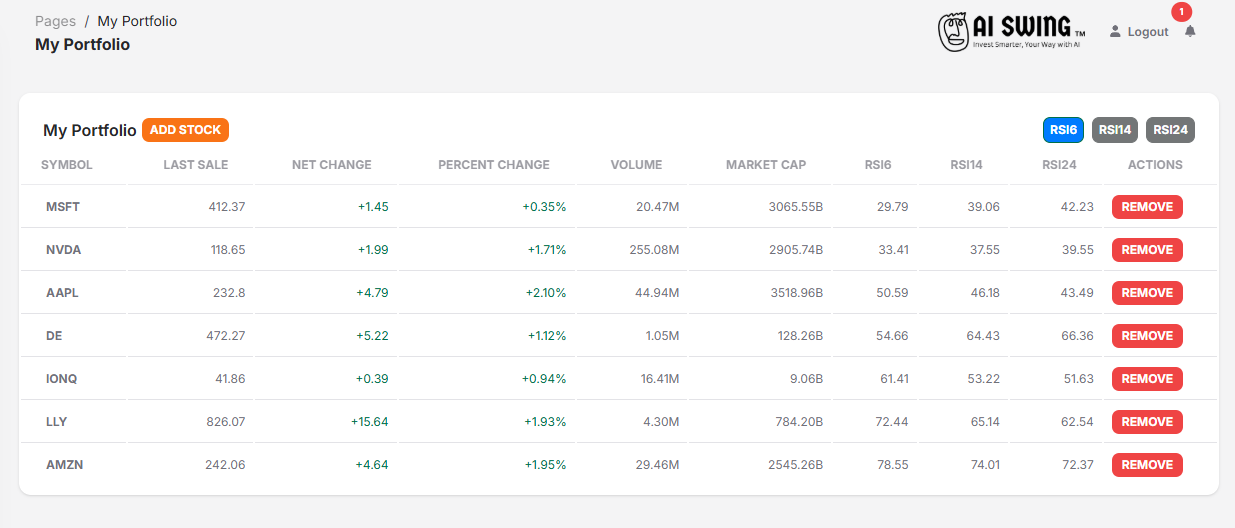
2. Portfolio Registration & Membership Levels
To help users customize their investment strategies, ai Swing™ offers different membership levels with portfolio registration limits.
Each membership plan determines how many stocks you can track in your portfolio:
- Free: Up to **5 stocks**
- Free Trial: Up to **20 stocks**
- Premium: Up to **50 stocks**
- Pro: Up to **100 stocks**
Upgrade your membership to track more stocks and maximize your investment insights.
3. My Strategy - Customizing Your Investment Approach
ai Swing™ allows you to customize your own **investment strategy** based on key technical indicators. You can set up **RSI thresholds, volume conditions, Bollinger Bands, and MACD-based trading signals** to receive **personalized buy and sell recommendations** tailored to your investment preferences.

📌 What is My Strategy?
With **My Strategy**, you can define a trading plan using the following customizable parameters:
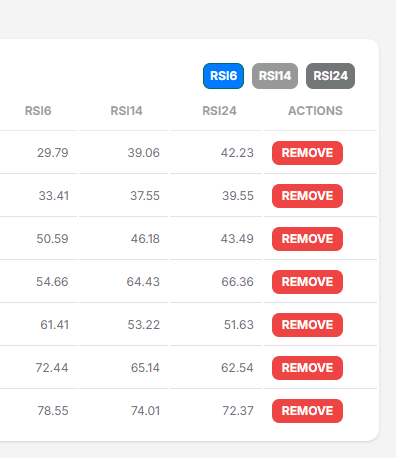
- RSI (Relative Strength Index) Based Trading
- Oversold RSI: Stocks below this level are considered **buy opportunities**. (Default: **30**)
- Overbought RSI: Stocks above this level are considered **sell opportunities**. (Default: **70**)
- RSI Period: Choose between **6, 14, or 24 days** RSI calculation.
- Volume-Based Trading
- Volume Increase (%): The minimum percentage increase in trading volume required for a signal.
- Volume Duration (Days): The number of days over which volume change is measured.
- Minimum Volume: The minimum daily volume required for the stock to be considered in recommendations.
- Bollinger Band Strategy
- Bollinger Buy: Buy when the stock price **touches or falls below** the lower Bollinger Band.
- Bollinger Sell: Sell when the stock price **touches or exceeds** the upper Bollinger Band.
- MACD (Moving Average Convergence Divergence) Trading
- Use MACD: Enable or disable MACD-based trading signals.
- MACD Threshold: Buy when **MACD > 0**, sell when **MACD < 0**.
- MACD Signal Threshold: Buy when **MACD crosses above** the Signal line, sell when it **crosses below**.
- MACD Histogram Threshold: Used to measure momentum.
- **Histogram > 0:** Strong Uptrend
- **Histogram < 0:** Strong Downtrend
🎯 Example: How to Set Up a Trading Strategy
Let's say you want to create a **breakout trading strategy** that buys oversold stocks with rising volume.
- RSI: Oversold at **28**, Overbought at **72** (More aggressive thresholds)
- Volume: Needs to increase by **50%** over the past **5 days**
- Bollinger Bands: Buy when price **touches lower band**
- MACD: Buy when **MACD crosses above** the Signal line
Once saved, ai Swing™ will automatically **scan your registered portfolio stocks daily** and generate personalized **buy and sell recommendations** based on this strategy.
📢 Important Notes
- You can only create **ONE** strategy per user.
- Modifying your strategy **immediately updates** your recommendations.
- ai Swing™ does **not execute trades**—all buy/sell decisions are up to you.
Ready to create your strategy? Go to My Strategy and start customizing today! 🚀
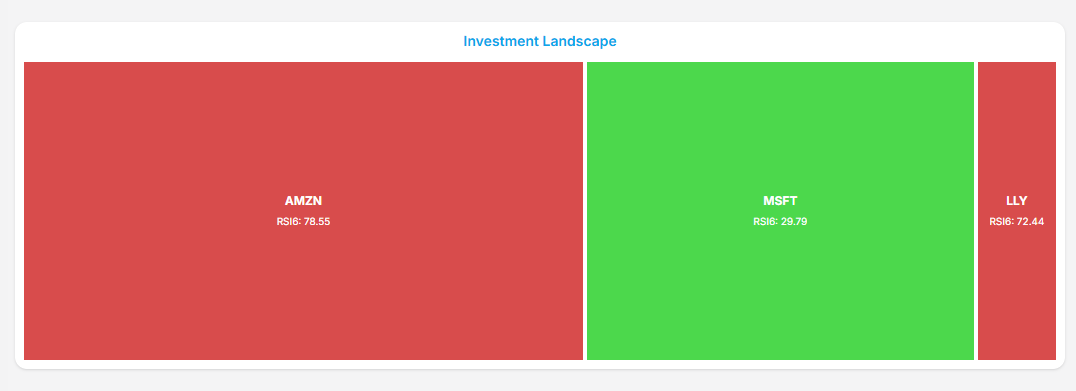
4. Investment Landscape
Every investment decision should start with a clear landscape. Our system provides a **real-time heatmap** of your portfolio stocks, highlighting whether they are in an overbought or oversold condition.
Green areas indicate **buying opportunities**, while red zones suggest potential **sell signals**.
5. RSI Analysis & Market Sentiment
Our primary buy/sell signals are based on **Relative Strength Index (RSI)** calculations:
- RSI < 30: **Buy Zone** - Stock is considered oversold.
- RSI > 70: **Sell Zone** - Stock may be overbought.
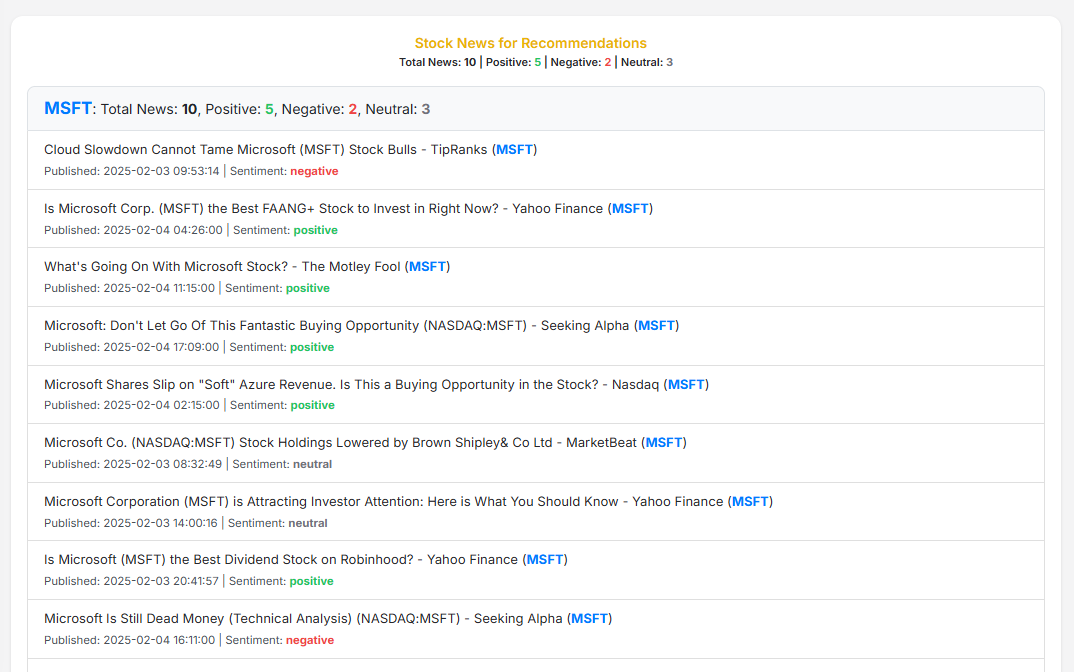
Additionally, we analyze market sentiment through **news-based AI sentiment analysis**. This helps you gauge the general sentiment of news related to your stocks:
- 🟢 **Positive Sentiment:** Good news may drive prices up.
- 🔴 **Negative Sentiment:** Caution advised due to concerning news.
Remember, **we do not make investment decisions for you**—our system provides **data-driven insights**, but all trading decisions are your own.
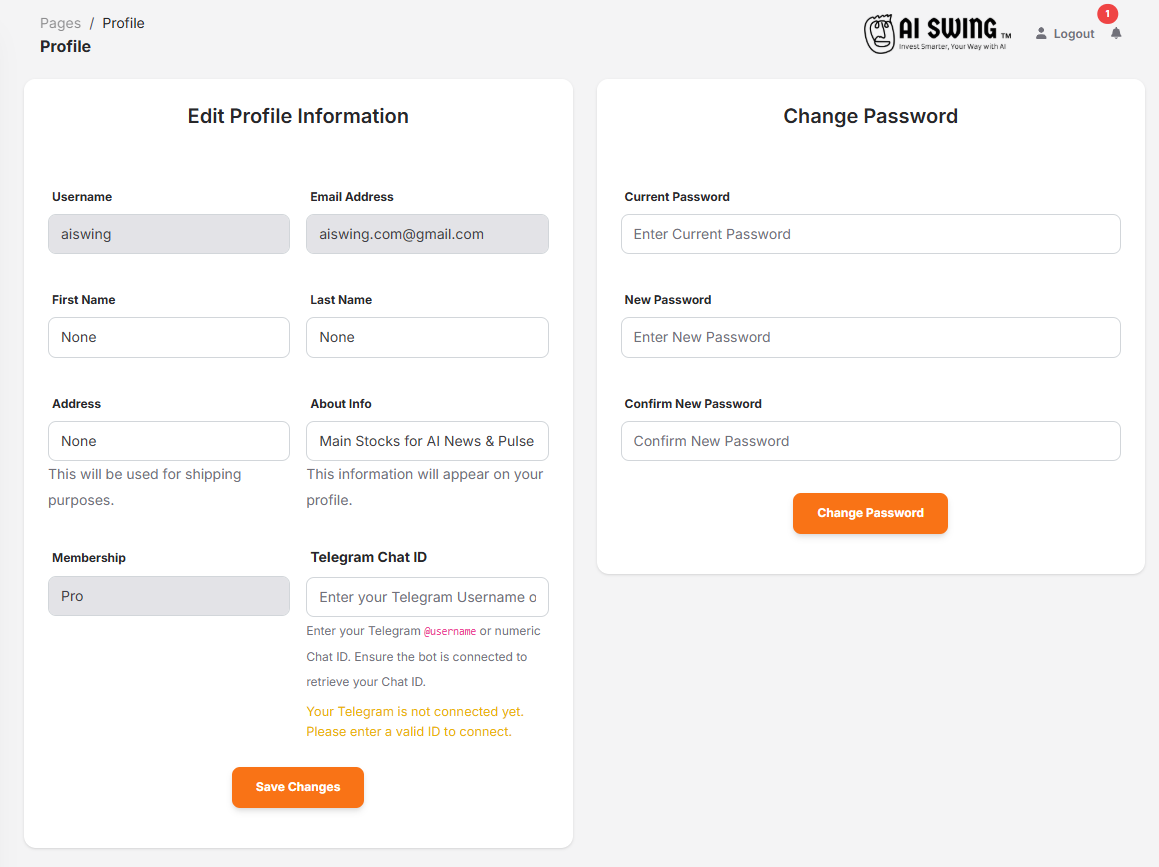
6. User Profile & Telegram Alerts
Stay ahead with **personalized daily alerts**. By connecting your Telegram ID, you will receive automated notifications on which stocks to buy or sell daily.
Follow these steps:
- Join Telegram and search for @aiSwingNotifierBot.
- Click /start to activate the bot.
- Enter your Telegram username (e.g., @userid) in the profile section.
- Once registered, you will receive daily updates on stocks to buy and sell based on your portfolio.
⚠️ **Disclaimer:** ai Swing™ does not provide financial advice or guarantee investment success. You are responsible for your own trading decisions.